I have a trading tool for this market, and I backtest strategies on the data. So the analysis of 112,000 Polymarket wallets interested me not for its talk about luck, but for the parts that can be counted.
The analysis is by darkzodchi (@zodchiii), March 2026: "I Analyzed 112,000 Polymarket Wallets. Here's What Separates the Top 1% from Everyone Else."
I did not read the original post on X. I read the English summaries on BlockBeats and HTX, so the numbers come from the summaries, not from the original.
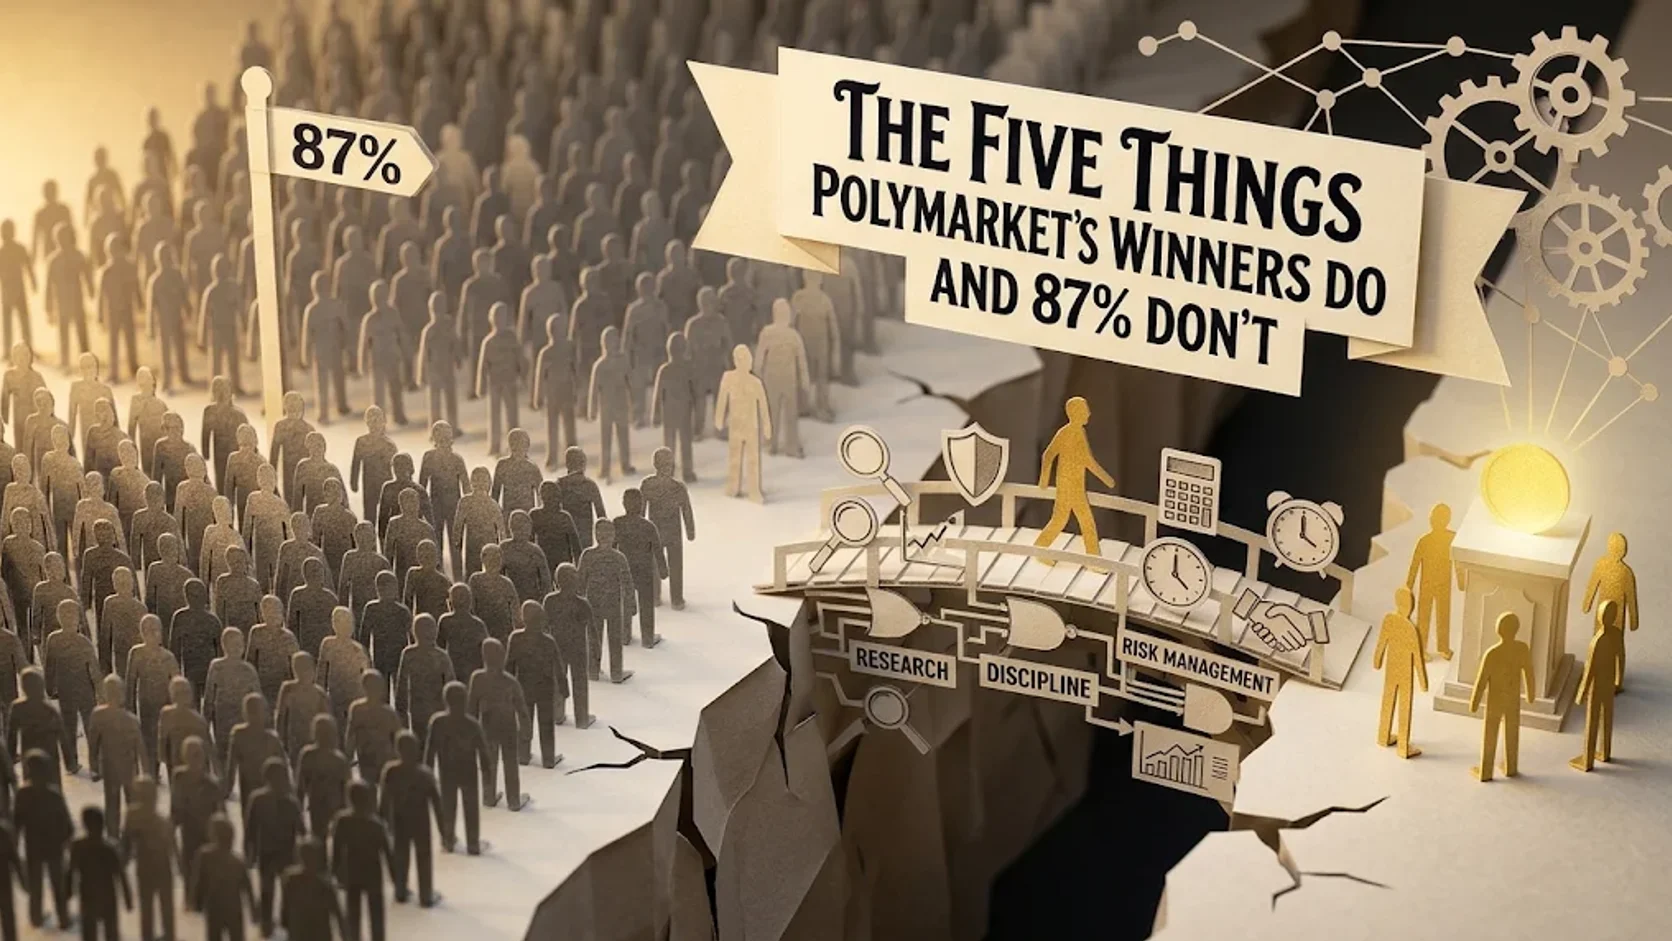
87.3% Are in the Red
Over six months the author collected about 112,000 wallets. 87.3% of them are in the red.
Then he filtered the sample down to 8,400: at least 100 settled positions, more than four months of activity, more than $10,000 in volume, and at least two markets. The point was to look not at a random account with one bet, but at people who traded for a long time and a lot.
That is the main fact. 87.3% is not a handful of losers, it is most of the market.
8,400 wallets is not two or three addresses. It is enough to talk about a distribution.
And no, this is not investment advice. One six-month snapshot, one filtered sample. Read it as a map of patterns, not as a promise of returns.
What follows is five patterns. Not five tips, but one algorithm: where to look for an edge, how to size it, where to trade, when to exit and when not to enter.
The Leaderboard Is a Stack of Lottery Tickets
Do not start with the leaderboard. The wallet at number one by PnL holds 22 positions. Number four has eight trades. Number eight has one bet.
That is not trading. That is a stack of lottery tickets that happened to pay out. A person with one bet did not show skill, he showed that he hit.
And it is not only a lottery. The wallet with one bet might have been an insider: someone who knew the outcome or helped shape it. On prediction markets that is not hypothetical: in November researchers at Vanderbilt flagged a bet of almost $191,000 on a Nebraska Senate race an hour before the Times/Siena poll came out (NYT).
Knowing the outcome and having skill are different things. Inside information does not repeat, it cannot be learned, and the leaderboard does not tell the two apart. So the top row is not a place to study: it can be luck, it can be an insider, and skill is only the third option.
The table sorts by outcome, not by repeatability. Over a one-trade sample, noise beats any method.
As a builder, I do not need the top row, I need the distribution. The top row tells you what can happen. The distribution tells you what repeats.
A beginner sees the top row and copies the size, not the logic. But there is nothing to copy: one person has one bet, another has eight trades.
Pattern One: Sell the Expensive, Buy the Cheap
The top 50 wallets do not trade at 50/50. They sell YES at around 88% and buy at around 12%.
They do not enter in the middle. The price has to move 6-11% away from their estimate.
That is contrarian trading at the extremes. Profitable traders do not guess the outcome better than the market. They wait for the price to move far enough from their estimate to cover the risk.
Guessing the outcome is about knowledge. Contrarian trading is about the entry price. Neither works without the other: a correct estimate still loses money if the entry was at the market price.
The effect has a name: favorite-longshot bias, a distortion in how people price extreme probabilities, documented in horse-racing studies since the 1940s. On Polymarket you can see it in the tails, and there is a separate paper on weather markets (arXiv 2610.13593).
But the name matters less than the mechanics. A trade starts with a number: the price against my probability. Everything else is secondary.
Pattern Two: A Quarter of Kelly
The size of the position is proportional to the edge: about 7% of the bankroll on average. 12-15% at high confidence, 2-5% at medium, and no trade at all without an edge.
7% is not caution for its own sake. It is a quarter of full Kelly.
For a binary market the full fraction of the bankroll is f = (p − c) / (1 − c), where p is my probability and c is the price.
An example: my estimate is 60% and the price is 0.45. (0.60 − 0.45) / (1 − 0.45) = 0.15 / 0.55 = 27% of the bankroll. A quarter of that is about 7%.
Losers sit at two poles. Either 80% of the deposit on one trade, or $10 spread across forty or fifty markets. In both cases the size has nothing to do with the edge.
Put 80% into one trade and a mistake costs almost the whole account. At 7% the same mistake costs 7%.
The difference between the top and the bottom is not the forecast, it is the size. A correct forecast still wipes out the account if the bet eats the bankroll.
Pattern Three: One Category, Not Five
Specialization shows up in the money. Wallets with one or two categories average about $4,200 in profit. With three or four the average is a loss of $380. With five or more it is a loss of $2,100.
Then two cases.
One wallet traded only 15-minute bitcoin markets: 502 predictions, 98% accuracy, about $54,000. The edge was not intuition. It watched the order book depth on Binance and entered when the Polymarket price lagged by 10-30 seconds.
Another traded only weather markets, comparing the daily NOAA forecast with the market price. In the New York temperature market its accuracy was 94%.
Narrow focus is not a limitation, it is a way to remove variables. One market, one data source, one divergence you can measure. In both cases the advantage is mechanical: a lag to the order book and a comparison with a model.
Every new category brings its own rules, its own sources and its own mistakes. Five categories are five different jobs, and doing them at once is expensive.
Pattern Four: Exit on Price, Not on Outcome
The analysis has an example: entry at 0.40, exit at 0.65. The trigger to leave can be news or a shift in sentiment. Average holding time for the top wallets is 18-72 hours.
For the bottom half by profit, the position often hangs until resolution. For weeks.
There are even profitable addresses with no settled positions at all. They only scalp, meaning they never take the bet to resolution.
For me this is the most practical pattern. Profitable traders trade the movement of probability, not the outcome of the event. The exit is defined before the entry, not after the news has ruined the mood.
Exiting at 0.65 after entering at 0.40 is not a prediction of the outcome. It is taking the price move that already happened.
Pattern Five: Do Not Enter on the News
At the moment of the news the top wallets do not enter. They wait for emotional money to create a spike, and enter when the price has calmed down.
There are two good entries: before the market notices the event, or after it overreacts.
When everyone is discussing the same thing, the price already contains the consensus. There is no edge there.
On the news everyone sees the same headline, and there is nothing to argue about. The argument starts where the price has not caught up with the event, or has already overshot.
Waiting for the spike means not being first. Emotional money moves the price first, then the price stabilizes. Entering after stabilization is entering at a calmer price.
Five Rules and What a Builder Does With Them
Five rules follow from the analysis. Stick to one category for at least three months. Log every prediction: your probability, the price, the edge, the size. Bet about a quarter of Kelly. Enter only with an edge of 8-10% or more. Review your mistakes regularly.
I like these rules not because they are right, but because they are boring. They fit on a checklist, and every trade can be checked against it, with no genius and no secret signal.
Rule one removes extra markets. Rules two and five bring you back to your mistakes. Rule three sets the size, rule four filters out trades without an edge.
And the two cases show where discipline ends and mechanics begins. A lag to the Binance order book and a comparison of the NOAA forecast with the market price are not intuition. They are data and speed, exactly what a tool looks for.
Look for a divergence you can count, not for a genius. The Polymarket price against the exchange order book. The weather forecast against the market price. Your probability against the price. Three pairs, and every one has a number in it.
For a builder that is good news. Where there is a number there is something to check, and where there is a lag there is something to measure.
One more time about the limits. This is one study, one period, one filtered sample. The wallets in it are anonymous, and I do not know who is behind them. And this is not investment advice: I describe what the data shows, not what to do with your money.
For contrast I keep next to it a paper on insider trading and skill in Polymarket political markets (ACDC). It puts two explanations for profit side by side: skill and inside information. But the darkzodchi analysis is about repeatable habits, and those you can check against your own history.
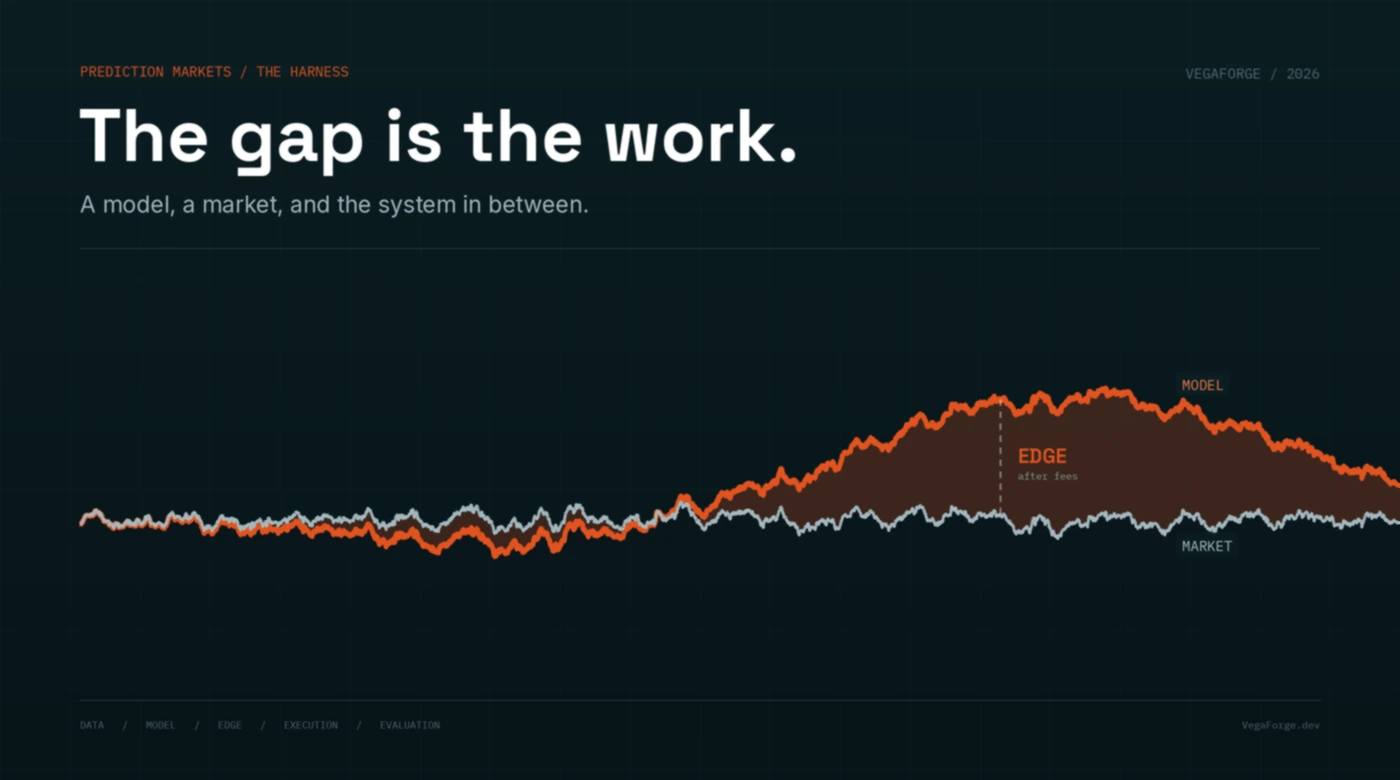
The five rules can be checked against your own journal. A lag to the order book or a comparison with a weather model has to be built. That is the harness, the system around the model. The tool grows out of that difference.
P.S. If you work on prediction markets or build tools for them, I would like to hear what you are building and where these numbers land in your own experience. Find me on X and we can compare notes.